Find Resources

Facilitator Resources (2023)

Posted June 11, 2023 by wellina

The following resources are created by Project GUTS facilitators to help prepare for 2023 GUTS workshops

Slides for 3 day workshop

Posted February 17, 2018 by sgibbs

These are generic slides we've used for 3 day workshops. They have been updated to show the correct screen shots of StarLogo Nova 2.0.

Guides, Common Forms, and Activity Sheets for CS in Science Modules

Posted July 27, 2018 by turtle

This 56-page pdf includes printable copies of the Student Activity Guides, Common Forms, Blocks Guides, CS Concepts, and Progress Monitors for Modules 1-4 of CS in Science. This version was created in 2015, for StarLogo Nova 1.0. If using StarLogo Nova 2.0, search for the Blocks guides attached to each module.

CS in Science Module 3: Ecosystems slide presentation

Posted July 27, 2018 by sgibbs

These are slide presentations for CS in Science Module 3: Ecosystems. Teachers can download and modify these slides for classroom use. Be sure to select the desired link below, for StarLogo Nova 1.0 (flash version) or StarLogo Nova 2.0 (HTML5/JavaScript version).

CS in Science Module 3: Ecosystems as Complex Systems (for StarLogo Nova 2.0)

Posted July 27, 2018 by turtle

This Life Science module begins with an exploration of a simple predator-prey model to consider who eats whom—and what happens when one population grows faster than another. Students develop their own model of a local ecosystem and learn about ecosystem dynamics, producers and consumers, and interdependent relationships within an ecosystem. This module has been updated for StarLogo Nova 2.0 (HTML5/JavaScript version, updated 2017).

Sample rubric for ecosystem module

Posted August 4, 2018 by sgibbs

This rubric was previously posted on the Code.org site and many teachers have found it to be helpful. You can save a copy and modify as fits your curriculum.

Module 3 Lesson 3 - Adding a Predator

Posted February 10, 2020 by wellina

In this lesson, students will modify the Rabbits and Grass model by adding a predator, a Mountain Lion, to answer a new question: “Does adding a top predator increase or decrease the stability of an ecosystem?” In the second activity, students will design and run experiments to see if adding a predator has an impact on the ecosystem. This activity will reinforce the concepts of energy flow through ecosystems and the often unexpected results of interactions in complex adaptive systems.

Module 3 Lesson 4 - Create Your Own Ecosystem Model

Posted February 10, 2020 by wellina

In this lesson, students will design their own ecosystems projects consisting of a question, experimental design and model. In the first activity, students will learn about the computational science cycle and use it to scope their project. This leads to a second activity where they start designing and implementing their model.

Decode NYC Models

Posted January 13, 2021 by wellina

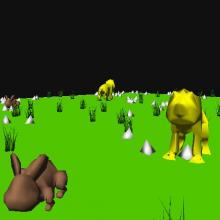
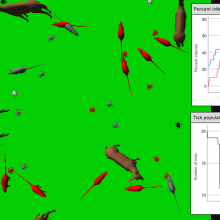
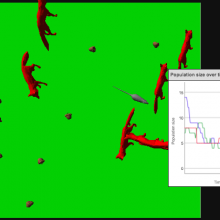
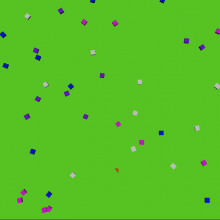
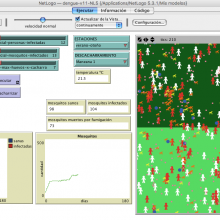
In the NSF-funded DecodeNYC program at the American Museum of Natural History, middle school students use the agent-based game and simulation programming environment StarLogo Nova to use, modify, decode, and create scientific models to test different strategies for fighting Lyme disease and answer questions about their urban ecosystem.

DECODE NYC Virtual Lesson Plan - MODIFYING A MODEL: OMNIVOROUS FOXES

Posted January 27, 2021 by wellina

This remote lesson serves as an opportunity for students to modify the code of an agent-based model to reflect the complexity of real-world food webs. Students will evaluate theeffectiveness of the modifications based on their understanding of population dynamics.

Natural Selection Programming

Posted May 11, 2021 by sgibbs

A lesson for middle school science that uses a variation of the rabbits and grass program to explore concepts of natural selection.

Natural Selection Prey and Predator

Posted May 14, 2021 by sgibbs

This post includes a link to a model that can be used with the OpenSciEd Bacteria Food Hunt Unit net logo simulation.

Simulación de un brote de Dengue

Posted March 29, 2017 by Rizzi

Este modelo simula la transmisión del virus del dengue en un barrio de cuatro manzanas durante 180 días. El vector del virus es el mosquito Aedes egyptii. La simulación muestra un gráfico con la evolución del brote (el cambio en la cantidad de personas sanas y de personas infectadas), otro gráfico con la evolución de la población de mosquitos y unos monitores que indican el estado de la población de mosquitos y cuántas personas fueron infectadas.

If you can't find what you're looking for, send us a comment about what you were expecting to find.