Find Resources

Locating the Epicenter of an Earthquake Lesson

Posted February 28, 2020 by wellina

Identify the location of an earthquake epicenter using a travel time graph and three seismograph tracings. The epicenter is the point on Earth's surface directly above an earthquake. Seismic stations detect earthquakes by the tracings made on seismographs. Tracings made at three separate seismic stations are needed to locate an earthquake epicenter.

The Greenhouse Effect

Posted July 27, 2018 by sgibbs

A short video on the basics of the greenhouse effect, used in CS in Science, Module 2 (Greenhouse gas model).

Daisy world

Posted April 3, 2017 by turtle

A model demonstrating the albedo effect of black or white surfaces. Use as a part of the Climate Change and Agriculture Project GUTS Curricular Unit, or as a stand-alone model, activity, and video.

An Example of CT in the Workplace

Posted May 15, 2017 by ilee

This is an example of how a computer modeler uses various aspect of computational thinking while designing, creating and using a computer model as a tool to think with.

Introducción al modelado del clima

Posted May 16, 2017 by Rizzi

Documento base como introducción al modelado del clima. Habla sobre el sistema climático global como un sistema dinámico complejo; la diferencia entre tiempo y clima; los ciclos de retroalimentación en el sistema climático global, etc.
Fue extraído de “Mathematics of Climate Change: A new discipline for an uncertain century” una publicación del Instituto de Investigación en Ciencias Matemáticas. Berkeley, CA 2007 y traducido al español.

Bloques de código para modelo de cambio climático

Posted May 16, 2017 by Rizzi

Es una hoja de referencia con los bloques de código necesarios para el modelo de cambio climático. Se explica bloque por bloque qué función cumple cada estructura en cada pestaña de la programación con StarLogo NOVA.

Papeles en el viento ("Papercatchers")

Posted May 17, 2017 by Rizzi

"Papeles en el viento" (Papercatchers) es una simulación participativa en la que los estudiantes aprenden sobre el crecimiento de la población y los límites al crecimiento. Los estudiantes desempeñan el papel de miembros de una población creciente, siguen reglas sencillas que rigen la supervivencia y la reproducción, y recopilan y grafican datos.

Interview with Hal Scheintaub

Posted August 2, 2017 by ilee

Teachers with GUTS interviewed Hal Scheintaub and demo of StarLogo Nova models created by his students on August 2, 2017.

Papercatchers

Posted July 27, 2018 by turtle

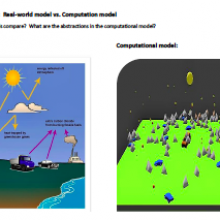
Papercatchers is a participatory simulation in which students learn about population growth and limits to growth. Students play the role of members of a growing population, follow simple rules governing survival and reproduction, and collect and graph data.

What's Represented?

Posted June 12, 2019 by ilee

These exercises ask the learner to identify abstractions in the computer model as compared to a diagram or image of a natural phenomenon.

Toss-Up

Posted March 30, 2017 by turtle

As a virus spreads through a community, epidemiologists might study how far a disease has spread, how quickly it spreads and how infectious it can be as well a numerous other pieces of data in order to understand the disease and its potential impact on a community. In this activity, students will simulate the spread of a virus such as the flu. Students will work in pairs to accumulate data using graph paper, a data chart, and a die. Before starting, groups will need to decide on three variables.

If you can't find what you're looking for, send us a comment about what you were expecting to find.