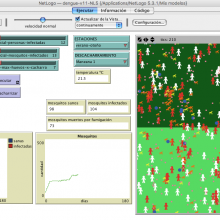
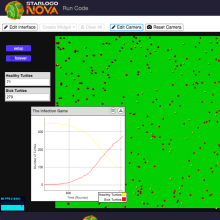
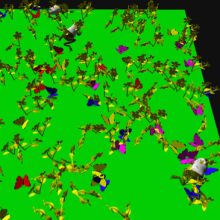
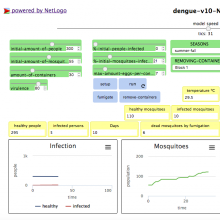
Este modelo simula la transmisión del virus del dengue en un barrio de cuatro manzanas durante 180 días. El vector del virus es el mosquito Aedes egyptii. La simulación muestra un gráfico con la evolución del brote (el cambio en la cantidad de personas sanas y de personas infectadas), otro gráfico con la evolución de la población de mosquitos y unos monitores que indican el estado de la población de mosquitos y cuántas personas fueron infectadas.
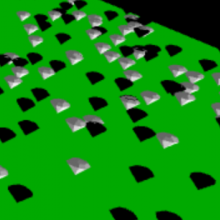
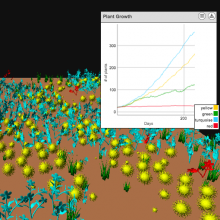
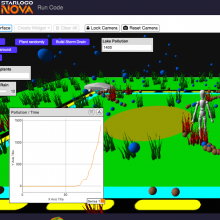
A model demonstrating the albedo effect of black or white surfaces. Use as a part of the Climate Change and Agriculture Project GUTS Curricular Unit, or as a stand-alone model, activity, and video.
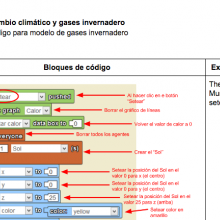
Es una hoja de referencia con los bloques de código necesarios para el modelo de cambio climático. Se explica bloque por bloque qué función cumple cada estructura en cada pestaña de la programación con StarLogo NOVA.
Spanish version of "SLNOVA 2.0: WHAT'S CHANGED OR NEW".
Versión en español del documento "SLNOVA 2.0: WHAT'S CHANGED OR NEW" con la comparación entre ambas versiones y el detalle de las nuevas funcionalidades de SLNOVA 2.0
This blocks guide can help students decode the base model used in Module 2 -- Water Resources. The links below correspond to either StarLogo Nova 1.0 (Flash version) or StarLogo Nova 2.0 (HTML5/JavaScript version).
A guide for students when decoding the Greenhouse Gases model for CS in Science (Module 5). The links below correspond to this model as created in StarLogo Nova 1.0 (Flash version) or StarLogo Nova 2.0 (HTML5/JavaScript version).
These links create a shortcut to find the StarLogo Nova 2.0 gallery for each module in CS in Science. For StarLogo Nova 1.0 galleries, go to flash.starlogonova.org.
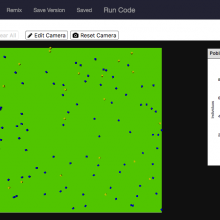
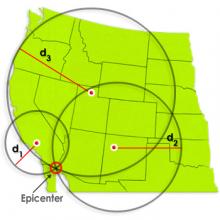
Identify the location of an earthquake epicenter using a travel time graph and three seismograph tracings. The epicenter is the point on Earth's surface directly above an earthquake. Seismic stations detect earthquakes by the tracings made on seismographs. Tracings made at three separate seismic stations are needed to locate an earthquake epicenter.
This model simulates the transmission of the dengue virus in a neighborhood of four blocks during 180 (one hundred and eighty) days. The vector of the virus is the mosquito Aedes egyptii. The simulation shows a chart of the evolution of the outbreak (the change in the number of healthy people and infected people), another graph with the evolution of the mosquito population and some monitors that indicate the state of the mosquito population and how many people were infected.