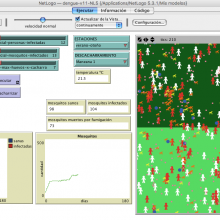
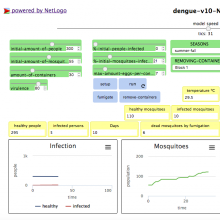
Este modelo simula la transmisión del virus del dengue en un barrio de cuatro manzanas durante 180 días. El vector del virus es el mosquito Aedes egyptii. La simulación muestra un gráfico con la evolución del brote (el cambio en la cantidad de personas sanas y de personas infectadas), otro gráfico con la evolución de la población de mosquitos y unos monitores que indican el estado de la población de mosquitos y cuántas personas fueron infectadas.
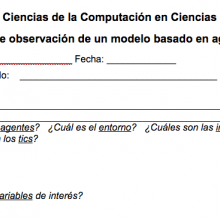
Se trata de una guía para poder observar un modelo basado en agentes y reconocer sus diferentes partes, como por ejemplo las abstracciones (quiénes son los agentes, cuál es el entorno, cuáles son las interacciones); la automatización; los supuestos y el análisis.
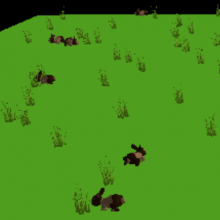
This is a worksheet to use while decoding the Rabbits and Grass Ecosystems Model - CS in Science, Module 3. Select the relevant link below, for StarLogo Nova 1.0 (flash version) or StarLogo Nova 2.0 (HTML5/JavaScript version).
This blocks guide can help students decode the base model used in Module 2 -- Water Resources. The links below correspond to either StarLogo Nova 1.0 (Flash version) or StarLogo Nova 2.0 (HTML5/JavaScript version).
A portion of a PBS NOVA video discussing the concept of emergence (or complex adaptive systems) where patterns emerge in nature where agents follow simple rules.
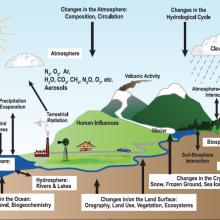
A guide for students when decoding the Greenhouse Gases model for CS in Science (Module 5). The links below correspond to this model as created in StarLogo Nova 1.0 (Flash version) or StarLogo Nova 2.0 (HTML5/JavaScript version).
This 56-page pdf includes printable copies of the Student Activity Guides, Common Forms, Blocks Guides, CS Concepts, and Progress Monitors for Modules 1-4 of CS in Science. This version was created in 2015, for StarLogo Nova 1.0. If using StarLogo Nova 2.0, search for the Blocks guides attached to each module.
A printable copy of the experimental design form, used in Project GUTS CS in Science Modules, for students to plan an experiment, including identifying variables, planning data collection and analysis, and interpretation.
This model simulates the transmission of the dengue virus in a neighborhood of four blocks during 180 (one hundred and eighty) days. The vector of the virus is the mosquito Aedes egyptii. The simulation shows a chart of the evolution of the outbreak (the change in the number of healthy people and infected people), another graph with the evolution of the mosquito population and some monitors that indicate the state of the mosquito population and how many people were infected.