Suggestions on best practices for teaching Project GUTS lessons, by acting as a facilitator to student learning, rather than a lecturer on your known content.
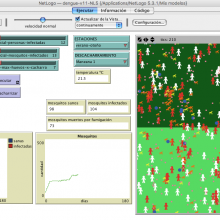
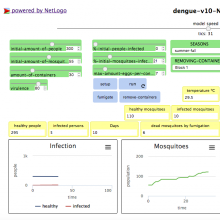
Este modelo simula la transmisión del virus del dengue en un barrio de cuatro manzanas durante 180 días. El vector del virus es el mosquito Aedes egyptii. La simulación muestra un gráfico con la evolución del brote (el cambio en la cantidad de personas sanas y de personas infectadas), otro gráfico con la evolución de la población de mosquitos y unos monitores que indican el estado de la población de mosquitos y cuántas personas fueron infectadas.
BSCS (Biological Sciences Curriculum Study) paper explaining the 5e instructional model. The model describes a teaching sequence that can be used for entire programs, specific units, and individual lessons. The BSCS 5E Instructional Model plays a significant role in the curriculum development process as well as the enactment of curricular materials in science classrooms.
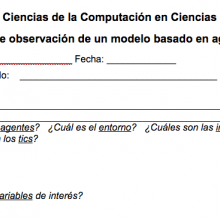
Se trata de una guía para poder observar un modelo basado en agentes y reconocer sus diferentes partes, como por ejemplo las abstracciones (quiénes son los agentes, cuál es el entorno, cuáles son las interacciones); la automatización; los supuestos y el análisis.
Spanish version of "SLNOVA 2.0: WHAT'S CHANGED OR NEW".
Versión en español del documento "SLNOVA 2.0: WHAT'S CHANGED OR NEW" con la comparación entre ambas versiones y el detalle de las nuevas funcionalidades de SLNOVA 2.0
A portion of a PBS NOVA video discussing the concept of emergence (or complex adaptive systems) where patterns emerge in nature where agents follow simple rules.
A printable copy of the experimental design form, used in Project GUTS CS in Science Modules, for students to plan an experiment, including identifying variables, planning data collection and analysis, and interpretation.
This model simulates the transmission of the dengue virus in a neighborhood of four blocks during 180 (one hundred and eighty) days. The vector of the virus is the mosquito Aedes egyptii. The simulation shows a chart of the evolution of the outbreak (the change in the number of healthy people and infected people), another graph with the evolution of the mosquito population and some monitors that indicate the state of the mosquito population and how many people were infected.