A guide for students when decoding the Greenhouse Gases model for CS in Science (Module 5). The links below correspond to this model as created in StarLogo Nova 1.0 (Flash version) or StarLogo Nova 2.0 (HTML5/JavaScript version).
Understanding by Design (UbD) curriculum offers a 3-stage “backward design” framework for developing units of study. The same process guides larger-scale curriculum development for courses and
programs (macro level). The UbD curriculum structure for building a coherent curriculum spirals around “big ideas,” essential questions, and core assessments.
BSCS (Biological Sciences Curriculum Study) paper explaining the 5e instructional model. The model describes a teaching sequence that can be used for entire programs, specific units, and individual lessons. The BSCS 5E Instructional Model plays a significant role in the curriculum development process as well as the enactment of curricular materials in science classrooms.
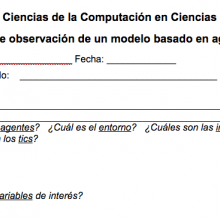
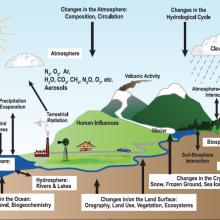
Se trata de una guía para poder observar un modelo basado en agentes y reconocer sus diferentes partes, como por ejemplo las abstracciones (quiénes son los agentes, cuál es el entorno, cuáles son las interacciones); la automatización; los supuestos y el análisis.
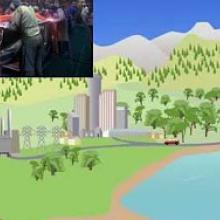
This blocks guide can help students decode the base model used in Module 2 -- Water Resources. The links below correspond to either StarLogo Nova 1.0 (Flash version) or StarLogo Nova 2.0 (HTML5/JavaScript version).
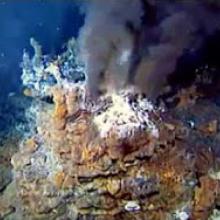
A portion of a PBS NOVA video discussing the concept of emergence (or complex adaptive systems) where patterns emerge in nature where agents follow simple rules.
This 56-page pdf includes printable copies of the Student Activity Guides, Common Forms, Blocks Guides, CS Concepts, and Progress Monitors for Modules 1-4 of CS in Science. This version was created in 2015, for StarLogo Nova 1.0. If using StarLogo Nova 2.0, search for the Blocks guides attached to each module.
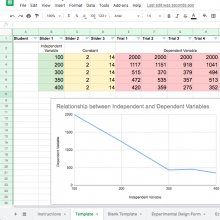
A printable copy of the experimental design form, used in Project GUTS CS in Science Modules, for students to plan an experiment, including identifying variables, planning data collection and analysis, and interpretation.
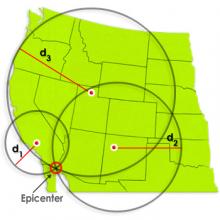
Identify the location of an earthquake epicenter using a travel time graph and three seismograph tracings. The epicenter is the point on Earth's surface directly above an earthquake. Seismic stations detect earthquakes by the tracings made on seismographs. Tracings made at three separate seismic stations are needed to locate an earthquake epicenter.
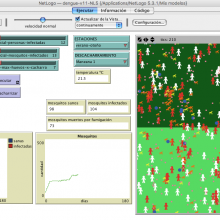
Este modelo simula la transmisión del virus del dengue en un barrio de cuatro manzanas durante 180 días. El vector del virus es el mosquito Aedes egyptii. La simulación muestra un gráfico con la evolución del brote (el cambio en la cantidad de personas sanas y de personas infectadas), otro gráfico con la evolución de la población de mosquitos y unos monitores que indican el estado de la población de mosquitos y cuántas personas fueron infectadas.