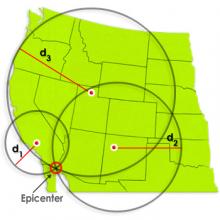
Identify the location of an earthquake epicenter using a travel time graph and three seismograph tracings. The epicenter is the point on Earth's surface directly above an earthquake. Seismic stations detect earthquakes by the tracings made on seismographs. Tracings made at three separate seismic stations are needed to locate an earthquake epicenter.
These links create a shortcut to find the StarLogo Nova 2.0 gallery for each module in CS in Science. For StarLogo Nova 1.0 galleries, go to flash.starlogonova.org.
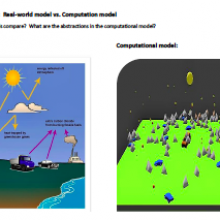
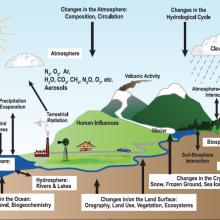
This slide presentation can be used for CS in Science Module 5: Greenhouse Gases. Teachers can download and modify this presentation for classroom use. Also note that this presentation was specifically developed for use in a module exploring climate change and water, but the first several slides include good general information.
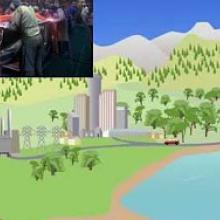
These slide presentations are for CS in Science Module 2: Water Resources. Please be sure to use the relevant link below, for either StarLogo Nova 1.0 (flash version) or StarLogo Nova 2.0. Also, note there is a different presentation for CS in Science Module 2: Climate Change. Teachers can download and modify these slides for classroom use.
A guide for students when decoding the Greenhouse Gases model for CS in Science (Module 5). The links below correspond to this model as created in StarLogo Nova 1.0 (Flash version) or StarLogo Nova 2.0 (HTML5/JavaScript version).
This blocks guide can help students decode the base model used in Module 2 -- Water Resources. The links below correspond to either StarLogo Nova 1.0 (Flash version) or StarLogo Nova 2.0 (HTML5/JavaScript version).
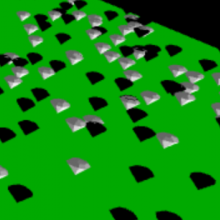
A model demonstrating the albedo effect of black or white surfaces. Use as a part of the Climate Change and Agriculture Project GUTS Curricular Unit, or as a stand-alone model, activity, and video.