

Source https://www.nytimes.com/interactive/2015/07/08/us/census-race-map.html?action=c…
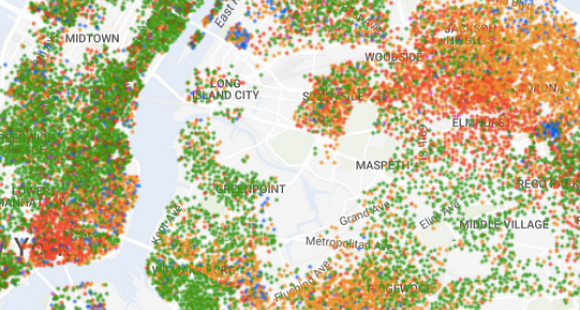
This interactive data visualization from the New York Times is a great way to introduce students to the issue of segregation using real-world data. It could be used to ground the Project GUTS unit on Segregation, and accompanying StarLogo Nova.
Log in or register to join the discussion