Find Resources

Simulación de un brote de Dengue

Posted March 29, 2017 by Rizzi

Este modelo simula la transmisión del virus del dengue en un barrio de cuatro manzanas durante 180 días. El vector del virus es el mosquito Aedes egyptii. La simulación muestra un gráfico con la evolución del brote (el cambio en la cantidad de personas sanas y de personas infectadas), otro gráfico con la evolución de la población de mosquitos y unos monitores que indican el estado de la población de mosquitos y cuántas personas fueron infectadas.

What are the chances?

Posted March 30, 2017 by turtle

An off-line activity to introduce students to concepts of randomness and how to program percent chance using a slider in StarLogo Nova.

Daisy world

Posted April 3, 2017 by turtle

A model demonstrating the albedo effect of black or white surfaces. Use as a part of the Climate Change and Agriculture Project GUTS Curricular Unit, or as a stand-alone model, activity, and video.

Data and Data Analysis video

Posted July 3, 2017 by sgibbs

A very short video (0.36) introducing the concepts of data and data analysis from StarLogo Nova models.

Interview with Hal Scheintaub

Posted August 2, 2017 by ilee

Teachers with GUTS interviewed Hal Scheintaub and demo of StarLogo Nova models created by his students on August 2, 2017.

Exploring the Wiggle Walk and Collisions via a Kinesthetic Activity

Posted August 4, 2017 by jhenderson

This activity teaches the Wiggle Walk blocks (random right by ___ degrees, random left by___ degrees), through a kinesthetic activity and explores when a programmer would want to code agents to move this way. It avoids the statical analysis of the random probabilities found in Module One, Lesson 4 Activity 1: Probability with Dice and Data and Colliding Turtles, while still addressing the end goals of the Module One Lesson 4.

Decode NYC Models

Posted January 13, 2021 by wellina

In the NSF-funded DecodeNYC program at the American Museum of Natural History, middle school students use the agent-based game and simulation programming environment StarLogo Nova to use, modify, decode, and create scientific models to test different strategies for fighting Lyme disease and answer questions about their urban ecosystem.

Debugging Challenges for StarLogo Nova

Posted July 27, 2018 by turtle

These challenges ask students to identify and correct common coding errors within StarLogo Nova programs. The first challenge is generic, all others relate to the content area module from CS in Science. Students like to solve the problems and fix the code, and learn about debugging skills while engaging further with content area modules. It is also a good review for instructions/facilitators before building code with students.

Coding Challenges

Posted July 27, 2018 by turtle

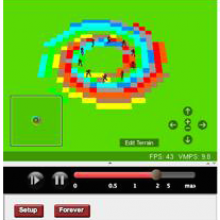
Coding Challenge are a series of short challenges that focus on improving coding skills using StarLogo Nova. Each set of challenges focuses on a specific concept: degrees & heading, x & y coordinates and randomness, conditions including absolute value and percent chance, adding color to the terrain and repeat loops, using the z coordinate, and other computer science concepts (logic blocks, data collection),.

Walk & Turn for StarLogo Nova

Posted July 27, 2018 by turtle

This is the CS in Science, Module 1, Activity 1 activity. Students participate in an activity acting as agents, then view a computer model, to introduce concepts of computer science and complex adaptive systems.

Alternate activities to introduce Project GUTS

Posted July 27, 2018 by turtle

Sometimes, teachers have a students who have already participated in Project GUTS introductory activities, and want to use something different, or want another activity to expand a lesson. Below are links to some alternate activities, both hands-on and on-line, for you to explore.

Skill Building Deck

Posted June 12, 2019 by ilee

A slide deck of exercises to build CS and decoding skills

COVID-19 Modelling Challenge

Posted March 18, 2020 by wellina

Learn basic StarLogo Nova skills then use those skills to customize your model to reflect how Coronavirus spreads. To that model, you can add different strategies and study the impact of the strategies on containing COVID-19’s spread.

Dengue outbreak simulation

Posted March 29, 2017 by Rizzi

This model simulates the transmission of the dengue virus in a neighborhood of four blocks during 180 (one hundred and eighty) days. The vector of the virus is the mosquito Aedes egyptii. The simulation shows a chart of the evolution of the outbreak (the change in the number of healthy people and infected people), another graph with the evolution of the mosquito population and some monitors that indicate the state of the mosquito population and how many people were infected.

If you can't find what you're looking for, send us a comment about what you were expecting to find.